Tired of using System.debug statements in your Apex class to debug your code? You should take a look at Apex Debuggers. Salesforce itself provides these Apex debugging tools! The initial days of Apex programming were pretty hard as no reliable debugging tools were available. One has to rely on the debug logs that have been generated within one Apex transaction. Additionally, one must add some debug statements in Apex code for more readability. Eventually, things started getting better. Before VS Code, Salesforce was planning an Eclipse extension for the debugger, which was giving some essential debugging operations. Later after the launch of VS Code, its been a new favorite IDE of programmers.
Apex Debugging Tools by Salesforce
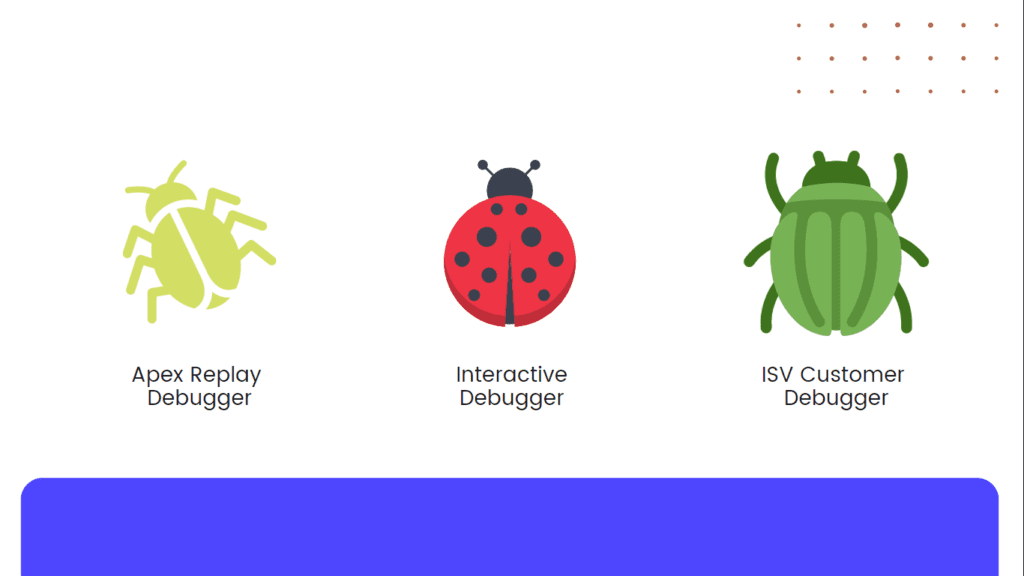
The essential tool that we need for debugging comes at no cost! Salesforce provides 3 types of Apex debuggers. Two of them are just VS Code extensions. We can install them on VS Code from Extensions Marketplace. Let’s take a look at these three debugging tools.
Apex Replay Debugger
Apex reply debugger is a free VS Code extension. We can use this extension to debug the Apex code with the help of the log file generated during the transaction. This reduces the efforts of going through thousands of lines of log files. It simulates the execution of the transaction which helps us to understand the flow of data. This extension comes up with Salesforce Extension Pack.
Apex replay debugger also displays the values held by the global or local variable at the specific instance. If you update the Apex code, you will need to generate new logs to use this debugger. After that, you can have as many as replays you need to resolve the buggy scenario.
To use Apex Reply Debugger, you need to invoke the Launch Apex Replay Debugger with the Current File command. You can use this command on Apex Class, Apex Test class, or Anonymous Apex file. You can set breakpoints/checkpoints on the lines you want to debug. You can update these breakpoints/checkpoints any time and again rerun the replay debugger with the same log file to get more details.
Apex Interactive Debugger
Unlike the Replay debugger, the Apex Interactive debugger will help you to debug apex code in real-time. It will work with the Sandboxes or Scratch orgs to debug the Apex class. VS Code will work like a client in this case. To use this extension, you need to install the Apex Interactive Debugger extension. This extension also comes up with Salesforce Extension Pack.
Before you start to debug, you need to set breakpoints/checkpoints in the .cls or .trigger files. To debug the code with an Interactive debugger, you need to invoke the command Launch Apex Debugger.
ISV Customer Debugger
ISV Customer Debugger helps ISVs to debug their code on Subscribers Org. This fills the gap between other debuggers. Because of the restrictions on seeking into the code of managed packages, subscribers can not debug the code on managed packages. With ISV Customer Debugger, ISVs will be able to work with their subscribers and debug their code in the subscriber’s org. This debugger is part of Interactive Debugger, So you don’t need to install anything other than Salesforce Extension Pack.
ISVs will require login to the customer’s sandbox using License Management Org. Upon approval for login access, you need to start a partner debugging session. After that, using the force id, you need to Create and Set Up Project for ISV Debugging.
More details on ISV Customer Debugger are on Salesforce’s official documentation.
Depending on the requirement, we can choose a specific debugger to resolve the issues. Most of the time, the Replay debugger will be helpful to resolve the bugs. For some typical scenarios, where we need real-time debugging, we can use an Interactive debugger. Unless you publish any package on App Exchange, you will not need to use ISV Customer Debugger.
Abhishek
Mr. Abhishek, an experienced Salesforce Application Architect with over 8+ years of development experience and 11x Salesforce Certified. His expertise is in Salesforce Development, including Lightning Web Components, Apex Programming, and Flow has led him to create his blog, SFDC Hub.